
In fast-moving operational environments, tools and machines outlive spreadsheets. Keeping an accurate pulse on an organization’s assets—whether IT devices, medical equipment, or non-IT items—is no longer optional. Dashboard reporting within an asset management platform serves as the central visual anchor for informed decision-making, operational visibility, and proactive control.
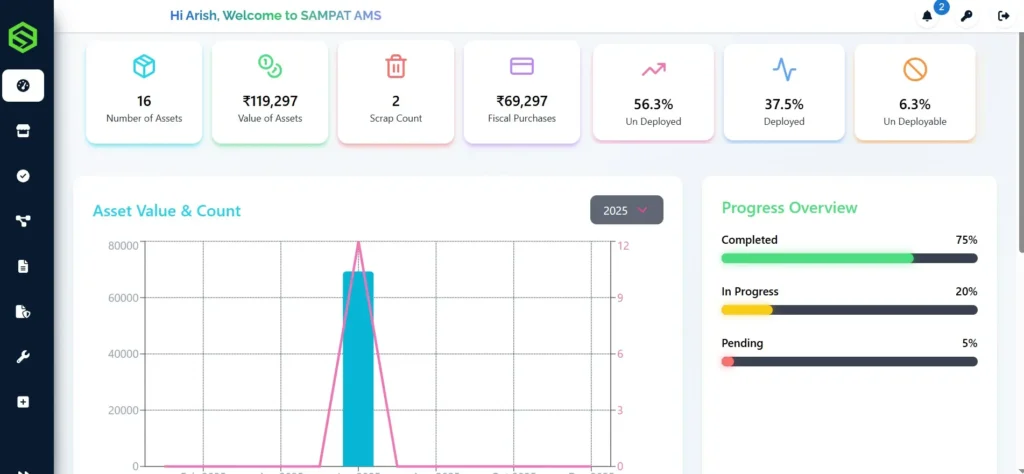
Below is a snapshot of a dashboard from SAMPAT AMS (Asset Management Software), showcasing key metrics like total asset value, deployment status, fiscal purchases, and progress overview. This reflects how real-time dashboards transform raw data into actionable insights.
What Is Dashboard Reporting?
Dashboard reporting refers to visually rich, real-time presentations of critical asset data—typically shown in charts, graphs, counters, and progress bars. It consolidates live metrics into a unified view for quick understanding, offering a user‑friendly overview rather than forcing users through multiple spreadsheets or custom reports.
Why Dashboards Are Essential in Asset Management
1. Real-Time Visibility Across Assets
A well-designed dashboard shows instant insights—current asset counts, financial value, deployment status, and scrap or undeployable ratios. This visibility removes guesswork and helps teams track asset health and usage at a glance, improving accountability and reducing asset misuse.
2. Proactive Lifecycle Monitoring
Dashboards help you track maintenance cycles, compliance due dates, or replacement timelines. Metrics like “scrap count” or progress percentages let admins spot potential issues—stalled deployments or overdue audits—and react before things escalate.
3. Decision‑Friendly Format
Visual summaries allow stakeholders to spot trends, allocate budgets, or change plans quickly. Rather than wading through tables, dashboards highlight both high-level status and detail-level breakdowns, enabling faster, data-driven choices.
Key Dashboard Elements in SAMPAT AMS
From the provided screenshot, several UI elements stand out—each playing a specific reporting role:
- Top Key Metrics – Counts like “Number of Assets,” “Value of Assets,” “Scrap Count,” and percentages of deployed or un-deployable assets offer concise operational context.
- Trend Charts – Graphs tracking fiscal purchases and asset count over time give visibility into seasonal patterns or budgeting cycles.
- Progress Overview Bars – Visual indicators for completed, in-progress, and pending actions provide a quick sense of process velocity.
- Deployment Status Intuition – Seeing deployed vs. un-deployed status helps in capacity planning and identifying potential bottlenecks.
Overall, these elements transform raw data into intuitive insights.

Benefits of Dashboard Reporting
Easier Performance Tracking
Dashboards make it clear how assets are performing across teams or departments—whether they’re idle, under maintenance, or fully deployed. This assists both asset managers and leadership to maintain oversight without extra meetings or manual tracking.
Fewer Manual Checks
Automated dashboards eliminate repetitive reporting tasks. Instead of manually compiling data into spreadsheets, teams can rely on automated visual summaries to stay informed.
Faster Communication and Collaboration
Dashboards create a shared source of truth. When multiple teams (IT, procurement, operations) look at the same metrics, miscommunication drops and timelines accelerate. Visuals also help non-technical stakeholders understand asset trends easily.
Custom KPI Focus
Instead of generic reporting, SAMPAT dashboards can tailor metrics to roles—finance teams see budget and value, maintenance teams focus on service due dates, and operations see deployment status. This targeted view boosts relevance and reduces clutter.
Best Practices for Effective Dashboard Reporting
Choose Relevant KPIs
Metrics should align with organizational goals—whether minimizing scrap, speeding up deployments, or maximizing ROI. As one best-practice guide notes, dashboards must monitor metrics tied to key goals or they risk becoming irrelevant.
Design for Readability
Arrange visuals to reflect natural viewing patterns—top-level insights first, followed by trends and detailed breakdowns. Avoid overcrowding; focus on clarity and whitespace.
Ensure Real-Time or Regular Updates
Dashboards are only as useful as the data they display. Automate data syncing so statistics—like asset value or deployment counts—remain current.
Tailor Views by User Role
Senior executives may need high-level trends, while maintenance supervisors need upcoming service schedules, and technicians need individual task checklists.
Real-World Impact
Organizations using actionable dashboards show clear improvements:
- Better asset allocation: Identify idle or underused assets to redeploy efficiently.
- Maintenance control: Pre-empt service needs before downtime occurs.
- Financial clarity: Track budget spending and asset depreciation with measurable trends.
- Audit readiness: Generate audit reports and asset summaries with minimal effort.
- Balanced Accountability: Progress visuals highlight task ownership across teams.
Bringing It All Together with SAMPAT
Dashboards aren’t an add-on—they act as the command center in modern asset management. SAMPAT’s asset dashboard integrates real-time counts, value calculations, deployment tracking, and progress bars in one unified interface, turning data into clear, actionable insight.
By offering configurable visuals, user-specific dashboards, and real-time sync, we offer teams clarity rather than confusion—and control instead of chaos.
Whether you’re a CIO reviewing asset investments or a technician scheduling service rounds, dashboards empower you to act confidently—guided by clear, up-to-date metrics.
Final Thoughts
Dashboard reporting is more than pretty charts—it’s the backbone of modern asset management. Clear visuals turn operational complexity into actionable insight, helping teams stay aligned and responsive. With SAMPAT platforms, dashboard reporting becomes a strategic asset in its own right.